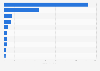
This statistic shows the brands of pizza crust (ready-made) used most often in the United States in 2020. The data has been calculated by Statista based on the U.S. Census data and Simmons National Consumer Survey (NHCS). According to this statistic, 26.8 million Americans used Digiorno in 2020.
U.S. population: Which brands of pizza crust (ready-made) do you use most often?
Basic Account
Get to know the platform
You only have access to basic statistics.
This statistic is not included in your account.
Starter Account
The ideal entry-level account for individual users
- Instant access to 1m statistics
- Download in XLS, PDF & PNG format
- Detailed references
$199 USD / Month *
Professional Account
Full access
Business Solutions including all features.
* Prices do not include sales tax.
Other statistics that may interest you Italian foods in the United States
Pasta
8
- Premium Statistic U.S. retail price of spaghetti 1995-2023
- Premium Statistic U.S. pasta and rice dollar sales by category 2018, by category
- Premium Statistic U.S. pasta and rice unit sales by category 2018, by category
- Premium Statistic U.S. pasta and rice market: average price per unit by category 2018, by category
- Premium Statistic U.S. private label market: pasta dollar sales by category 2019, by category
- Premium Statistic U.S. private label market: pasta dollar sales share by category 2019
- Premium Statistic U.S. private label market: pasta and rice unit sales by category 2018, by category
- Premium Statistic U.S. private label market: average price of pasta and rice by category 2018
Pizza
8
- Premium Statistic U.S. frozen pizza sales from 2015 to 2022
- Premium Statistic Sales of frozen pizza in the United States in 2019, by segment
- Premium Statistic Frozen pizza: market share of leading vendors in the U.S. 2019
- Premium Statistic Leading frozen pizza brands year-on-year sales growth U.S. 2022
- Premium Statistic U.S. dollar sales of the leading refrigerated pizza vendors 2021
- Premium Statistic U.S. unit sales of the leading refrigerated pizza vendors 2021
- Premium Statistic U.S. dollar sales of the leading pizza and pizza kit brands 2023
- Premium Statistic Sales share of the leading frozen pizza dough/crust vendors in the U.S. 2021
Cheese
3
Consumer behavior
7
- Basic Statistic U.S. per capita consumption of Italian cheese 2000-2022
- Premium Statistic Brands of frozen pizzas (bought frozen) consumed in the U.S. 2011-2020
- Premium Statistic Amounts of frozen pizzas (bought frozen) consumed in the U.S. 2011-2020
- Premium Statistic Frozen pizza penetration in U.S. households in 2019, by income
- Premium Statistic Usage of dry packaged pasta in the U.S. 2014-2024
- Premium Statistic Usage of spaghetti / pasta sauce in the U.S. 2011-2024
- Premium Statistic Most used brands of spaghetti / pasta sauce in the U.S. 2011-2020
Further related statistics
10
- Coal consumption in South Africa 1998-2022
- Leading banks in the Middle East in 2023, by brand value
- Number of Hugo Boss stores worldwide in 2023, by region
- Hugo Boss - EBITDA 2005-2023
- AstraZeneca's revenue from top product Pulmicort 2006-2023
- Import volume of cobalt in the U.S. 2010-2023
- Primary energy consumption in Asia Pacific 2022
- Primary energy consumption change in China 2000-2022
- Global primary energy consumption 2022, by country
- Primary energy consumption in South Korea 2021-2022, by fuel
Further Content: You might find this interesting as well
Statistics
- Coal consumption in South Africa 1998-2022
- Leading banks in the Middle East in 2023, by brand value
- Number of Hugo Boss stores worldwide in 2023, by region
- Hugo Boss - EBITDA 2005-2023
- AstraZeneca's revenue from top product Pulmicort 2006-2023
- Import volume of cobalt in the U.S. 2010-2023
- Primary energy consumption in Asia Pacific 2022
- Primary energy consumption change in China 2000-2022
- Global primary energy consumption 2022, by country
- Primary energy consumption in South Korea 2021-2022, by fuel
Statista. (November 1, 2020). U.S. population: Which brands of pizza crust (ready-made) do you use most often? [Graph]. In Statista. Retrieved June 10, 2024, from https://www.statista.com/statistics/281442/us-households-brands-of-pizza-crust-used/
Statista. "U.S. population: Which brands of pizza crust (ready-made) do you use most often?." Chart. November 1, 2020. Statista. Accessed June 10, 2024. https://www.statista.com/statistics/281442/us-households-brands-of-pizza-crust-used/
Statista. (2020). U.S. population: Which brands of pizza crust (ready-made) do you use most often?. Statista. Statista Inc.. Accessed: June 10, 2024. https://www.statista.com/statistics/281442/us-households-brands-of-pizza-crust-used/
Statista. "U.S. Population: Which Brands of Pizza Crust (Ready-made) Do You Use Most Often?." Statista, Statista Inc., 1 Nov 2020, https://www.statista.com/statistics/281442/us-households-brands-of-pizza-crust-used/
Statista, U.S. population: Which brands of pizza crust (ready-made) do you use most often? Statista, https://www.statista.com/statistics/281442/us-households-brands-of-pizza-crust-used/ (last visited June 10, 2024)
U.S. population: Which brands of pizza crust (ready-made) do you use most often? [Graph], Statista, November 1, 2020. [Online]. Available: https://www.statista.com/statistics/281442/us-households-brands-of-pizza-crust-used/