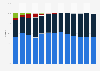
The statistic shows the market share of Samsung smartphones in the Middle East and Africa from 2011 to 2018, based on shipment. In 2018, Samsung's market share in the Middle East and Africa amounted to 25 percent, indicating a decrease in market share compared to 2017.
Market share of Samsung smartphones based on shipments in the Middle East and Africa from 2011 to 2018
Basic Account
Get to know the platform
You only have access to basic statistics.
This statistic is not included in your account.
Starter Account
The ideal entry-level account for individual users
- Instant access to 1m statistics
- Download in XLS, PDF & PNG format
- Detailed references
$199 USD / Month *
Professional Account
Full access
Business Solutions including all features.
* Prices do not include sales tax.
Other statistics that may interest you Smartphone market in Australia
Global overview
5
- Basic Statistic Global smartphone sales to end users 2007-2023
- Premium Statistic Global market share held by smartphone vendors 2012-2023
- Premium Statistic Average selling price of Android smartphones worldwide 2017 to 2023
- Basic Statistic Monthly data traffic per smartphone worldwide 2016-2028
- Premium Statistic Monthly mobile data traffic per smartphone worldwide 2016-2028, by region
National overview
5
- Premium Statistic Total number of mobile subscriptions Australia 2015-2022
- Premium Statistic Mobile subscriptions as a share of the population Australia 2015-2022
- Basic Statistic Market share held by smartphone OS in Australia 2012-2023
- Premium Statistic Most used smartphone apps by type in Australia 2023
- Premium Statistic Mobile web traffic in Australia 2023, by operating system
Smartphone brands and operators
6
- Premium Statistic Market share of mobile device vendors in Australia 2011-2023
- Premium Statistic Satisfaction with smartphone brand in Australia 2024
- Premium Statistic Willingness to change smartphone brand in Australia 2024
- Premium Statistic Smartphone by mobile carrier / brand in Australia 2024
- Premium Statistic Satisfaction with mobile carrier in Australia 2024
- Premium Statistic Most common mobile data plans in Australia 2024
Mobile internet and payments
5
- Premium Statistic Adults who access the internet with a mobile phone Australia 2023, by frequency
- Premium Statistic Availability of 5G in Australia 2023, by operator
- Premium Statistic Average 5G download speeds in Australia 2023, by operator
- Premium Statistic Biggest contactless payment brands at POS in Australia 2024
- Premium Statistic Mobile payments usage by situation in Australia 2024
Mobile apps
6
- Premium Statistic Leading social media apps downloaded in Australia 2024
- Premium Statistic Leading video on demand apps downloaded in Australia 2024
- Premium Statistic Leading music service apps downloaded in Australia 2024
- Premium Statistic Leading finance apps downloaded in Australia 2024
- Premium Statistic Mobile app spending in Australia 2020-2021, by category
- Premium Statistic Share of app downloads in Australia 2020-2021, by platform
Further related statistics
10
- Device usage among children to consume media in the United Kingdom (UK) 2013-2019
- Device preference for internet browsing in the United Kingdom (UK) 2015, by age
- Survey: ownership of mobile devices by U.S. American adults 2011-2012
- Number of employees at China Telecom 2012-2022
- Number of China Unicom fixed phone lines 2011-2021
- Mobile internet use via laptops in Great Britain 2019, by demographic
- Internet usage on a mobile phone in Great Britain 2010-2019, by age
- Podcast consumption on mobile in the U.S. 2017
- Use of smartphones by shoppers in retail stores in Italy in 2015
- Use of mobile devices to make restaurant reservations in the U.S. 2014, by age group
Further Content: You might find this interesting as well
Statistics
- Device usage among children to consume media in the United Kingdom (UK) 2013-2019
- Device preference for internet browsing in the United Kingdom (UK) 2015, by age
- Survey: ownership of mobile devices by U.S. American adults 2011-2012
- Number of employees at China Telecom 2012-2022
- Number of China Unicom fixed phone lines 2011-2021
- Mobile internet use via laptops in Great Britain 2019, by demographic
- Internet usage on a mobile phone in Great Britain 2010-2019, by age
- Podcast consumption on mobile in the U.S. 2017
- Use of smartphones by shoppers in retail stores in Italy in 2015
- Use of mobile devices to make restaurant reservations in the U.S. 2014, by age group
Counterpoint Research. (March 6, 2019). Market share of Samsung smartphones based on shipments in the Middle East and Africa from 2011 to 2018 [Graph]. In Statista. Retrieved June 10, 2024, from https://www.statista.com/statistics/985696/mea-samsung-smartphone-market-share/
Counterpoint Research. "Market share of Samsung smartphones based on shipments in the Middle East and Africa from 2011 to 2018." Chart. March 6, 2019. Statista. Accessed June 10, 2024. https://www.statista.com/statistics/985696/mea-samsung-smartphone-market-share/
Counterpoint Research. (2019). Market share of Samsung smartphones based on shipments in the Middle East and Africa from 2011 to 2018. Statista. Statista Inc.. Accessed: June 10, 2024. https://www.statista.com/statistics/985696/mea-samsung-smartphone-market-share/
Counterpoint Research. "Market Share of Samsung Smartphones Based on Shipments in The Middle East and Africa from 2011 to 2018." Statista, Statista Inc., 6 Mar 2019, https://www.statista.com/statistics/985696/mea-samsung-smartphone-market-share/
Counterpoint Research, Market share of Samsung smartphones based on shipments in the Middle East and Africa from 2011 to 2018 Statista, https://www.statista.com/statistics/985696/mea-samsung-smartphone-market-share/ (last visited June 10, 2024)
Market share of Samsung smartphones based on shipments in the Middle East and Africa from 2011 to 2018 [Graph], Counterpoint Research, March 6, 2019. [Online]. Available: https://www.statista.com/statistics/985696/mea-samsung-smartphone-market-share/