Children around the world face different health problems depending on a variety of factors, including, but not limited to, the region and country they are in, the income of their family, and their access to health care. For example, in 2021, around 72 children in Africa per 1,000 live births died in their first five years, compared to a rate of only 13 in the Americas. Furthermore, all of the 15 countries with the highest mortality rates among children aged under five were located in Africa. In the United States, the national infant mortality rate stood at 5.4 deaths per 1,000 live births as of 2020, with the state of Mississippi reporting the highest rate of any state.
Children's health - Statistics & Facts
Key insights
- State with the lowest infant mortality rate
- North Dakota

Detailed statistics
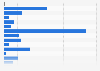
U.S. infant mortality rate by state 2021
- Substance most often involved in pediatric poisonings
- Cleaning substances (household)

Detailed statistics
Leading substances causing pediatric poisonings in the U.S. 2022
- Percentage of children who had received an MMR vaccination by age 24 months
- 92%

Detailed statistics
MMR vaccination rate among U.S. children before 24 months 2013-2020
Editor’s Picks Current statistics on this topic


Further recommended statistics
Diseases, disorders, risk factors
11
- Basic Statistic U.S. children diagnosed with a developmental disability as of 2015-2018, by condition
- Basic Statistic Prevalence of children diagnosed with an intellectual disability 2019-2021, by gender
- Premium Statistic Prevalence of autism in children aged 8 years in selected U.S. states by gender 2020
- Basic Statistic Percentage of U.S. children with ADHD from 1997 to 2018
- Basic Statistic Share of U.S. children who ever had ADHD from 2020 to 2022, by gender
- Basic Statistic Lifetime prevalence of asthma among U.S. children in 2021, by state
- Basic Statistic Prevalence of obesity among U.S. population aged 2–19 years from 1963 to 2018, by age
- Basic Statistic Obesity rates among 10-17 year-olds in the U.S. in 2020-2021, by state
- Premium Statistic Prevalence of dental caries among U.S. children from 2017 to 2020, by age and gender
- Premium Statistic Share of U.S. children and adolescents with oral health problems in 2022, by state
- Basic Statistic U.S. children who had a regular bedtime during a school week 2020, by frequency
Diseases, disorders, risk factors
-
Basic Statistic
U.S. children diagnosed with a developmental disability as of 2015-2018, by condition

U.S. children diagnosed with a developmental disability as of 2015-2018, by condition
Percentage of U.S. children aged 3-17 years ever diagnosed with a developmental disability as of 2015-2018, by condition
-
Basic Statistic
Prevalence of children diagnosed with an intellectual disability 2019-2021, by gender

Prevalence of children diagnosed with an intellectual disability 2019-2021, by gender
Prevalence of children aged 3-17 that have ever been diagnosed with an intellectual disability from 2019 to 2021, by gender
-
Premium Statistic
Prevalence of autism in children aged 8 years in selected U.S. states by gender 2020

Prevalence of autism in children aged 8 years in selected U.S. states by gender 2020
Prevalence of autism spectrum disorder among children aged 8 years in selected U.S. states in 2020, by gender (per 1,000 children)
-
Basic Statistic
Percentage of U.S. children with ADHD from 1997 to 2018

Percentage of U.S. children with ADHD from 1997 to 2018
Percentage of children in the U.S. with attention deficit hyperactivity disorder (ADHD) from 1997 to 2018
-
Basic Statistic
Share of U.S. children who ever had ADHD from 2020 to 2022, by gender

Share of U.S. children who ever had ADHD from 2020 to 2022, by gender
Percentage of children in the U.S. who ever had attention deficit hyperactivity disorder from 2020 to 2022, by gender
-
Basic Statistic
Lifetime prevalence of asthma among U.S. children in 2021, by state

Lifetime prevalence of asthma among U.S. children in 2021, by state
Lifetime prevalence of asthma among children in the United States as of 2021, by state*
-
Basic Statistic
Prevalence of obesity among U.S. population aged 2–19 years from 1963 to 2018, by age

Prevalence of obesity among U.S. population aged 2–19 years from 1963 to 2018, by age
Prevalence of obesity among children and adolescents in the United States aged 2–19 years from 1963 to 2018, by age*
-
Basic Statistic
Obesity rates among 10-17 year-olds in the U.S. in 2020-2021, by state

Obesity rates among 10-17 year-olds in the U.S. in 2020-2021, by state
Obesity rates among children aged 10-17 years in the United States in 2020-2021, by state
-
Premium Statistic
Prevalence of dental caries among U.S. children from 2017 to 2020, by age and gender

Prevalence of dental caries among U.S. children from 2017 to 2020, by age and gender
Prevalence of dental caries among U.S. children and adolecents from 2017 to March 2020, by age and gender*
-
Premium Statistic
Share of U.S. children and adolescents with oral health problems in 2022, by state

Share of U.S. children and adolescents with oral health problems in 2022, by state
Percentage of children and adolescents aged 1 to 17 years who had oral health problems in the U.S. in 2022, by state
-
Basic Statistic
U.S. children who had a regular bedtime during a school week 2020, by frequency

U.S. children who had a regular bedtime during a school week 2020, by frequency
Distribution of children aged 5 to 17 years who had a regular bedtime during a typical school week in the United States in 2020, by frequency
Causes of death
11
- Premium Statistic U.S. neonatal and postneonatal mortality rates from 1995 to 2021
- Basic Statistic Number of U.S. neonatal and postneonatal deaths from 1995 to 2021
- Basic Statistic U.S. infant mortality rate by state 2021
- Basic Statistic Distribution of sudden unexpected infant deaths in the U.S. in 2020, by cause
- Premium Statistic U.S. infant mortality rates 2018-2021, by leading causes
- Basic Statistic Number of infant deaths in the U.S. from 2019 to 2021, by leading causes
- Basic Statistic Leading causes of infant death in the United States 2022
- Basic Statistic Leading causes of death among children aged 1-4 years in the United States 2020-2021
- Basic Statistic Leading causes of death among children aged 5-9 years in the United States 2020-2021
- Basic Statistic Leading causes of death among children aged 10-14 years in the United States 2020-21
- Premium Statistic Leading substances causing pediatric poisoning deaths in the U.S. 2022
Causes of death
-
Premium Statistic
U.S. neonatal and postneonatal mortality rates from 1995 to 2021

U.S. neonatal and postneonatal mortality rates from 1995 to 2021
Rates of neonatal and postneonatal deaths in the U.S. from 1995 to 2021 (per 1,000 live births)
-
Basic Statistic
Number of U.S. neonatal and postneonatal deaths from 1995 to 2021

Number of U.S. neonatal and postneonatal deaths from 1995 to 2021
Number of neonatal and postneonatal deaths in the U.S. from 1995 to 2021
-
Basic Statistic
U.S. infant mortality rate by state 2021
U.S. infant mortality rate by state 2021
Infant mortality rate in the United States as of 2021, by state (deaths per 1,000 live births)
-
Basic Statistic
Distribution of sudden unexpected infant deaths in the U.S. in 2020, by cause

Distribution of sudden unexpected infant deaths in the U.S. in 2020, by cause
Distribution of sudden unexpected infant deaths in the United States in 2020, by cause
-
Premium Statistic
U.S. infant mortality rates 2018-2021, by leading causes

U.S. infant mortality rates 2018-2021, by leading causes
Infant mortality rates in the U.S. from 2018 to 2021, by leading causes (per 100,000 live births)
-
Basic Statistic
Number of infant deaths in the U.S. from 2019 to 2021, by leading causes

Number of infant deaths in the U.S. from 2019 to 2021, by leading causes
Number of infant deaths in the U.S. from 2019 to 2021, by leading causes
-
Basic Statistic
Leading causes of infant death in the United States 2022

Leading causes of infant death in the United States 2022
Distribution of the 10 leading causes of infant death in the United States in 2022*
-
Basic Statistic
Leading causes of death among children aged 1-4 years in the United States 2020-2021

Leading causes of death among children aged 1-4 years in the United States 2020-2021
Distribution of the 10 leading causes of death among children aged 1 to 4 years in the United States in 2020 and 2021
-
Basic Statistic
Leading causes of death among children aged 5-9 years in the United States 2020-2021

Leading causes of death among children aged 5-9 years in the United States 2020-2021
Distribution of the 10 leading causes of death among children aged 5 to 9 years in the United States in 2020 and 2021
-
Basic Statistic
Leading causes of death among children aged 10-14 years in the United States 2020-21

Leading causes of death among children aged 10-14 years in the United States 2020-21
Distribution of the 10 leading causes of death among children and adolescents aged 10 to 14 years in the United States in 2020 and 2021
-
Premium Statistic
Leading substances causing pediatric poisoning deaths in the U.S. 2022

Leading substances causing pediatric poisoning deaths in the U.S. 2022
Substances most frequently involved in pediatric poisoning deaths in the U.S. in 2022
Health insurance and health care professionals
9
- Premium Statistic Medicaid and CHIP child enrollee numbers October 2023, by state
- Basic Statistic Number of Medicaid/CHIP children's health care quality measures 2020
- Basic Statistic Uninsured U.S. children percentage and rate by age 2022
- Basic Statistic Uninsured U.S. children number by age 2022
- Basic Statistic Uninsured U.S. children number by ethnicity 2022
- Basic Statistic Uninsured U.S. children total number by family income 2022
- Premium Statistic People per active physician in the U.S. by specialty 2021
- Premium Statistic U.S. children and adolescents with a primary care visit by age 2017-2019
- Basic Statistic Share of U.S. children who visited the dentist in the past year 1997-2019
Health insurance and health care professionals
-
Premium Statistic
Medicaid and CHIP child enrollee numbers October 2023, by state

Medicaid and CHIP child enrollee numbers October 2023, by state
Number of children enrolled in Medicaid/CHIP as of October 2023, by U.S. state
-
Basic Statistic
Number of Medicaid/CHIP children's health care quality measures 2020

Number of Medicaid/CHIP children's health care quality measures 2020
Number of Medicaid/CHIP children's health care quality measures in 2020, by U.S. state
-
Basic Statistic
Uninsured U.S. children percentage and rate by age 2022

Uninsured U.S. children percentage and rate by age 2022
Percentage and rate of children without health insurance in the U.S. in 2022, by age group
-
Basic Statistic
Uninsured U.S. children number by age 2022

Uninsured U.S. children number by age 2022
Number of children without health insurance in the U.S. in 2022, by age (in millions)
-
Basic Statistic
Uninsured U.S. children number by ethnicity 2022

Uninsured U.S. children number by ethnicity 2022
Number of children without health insurance in the U.S. in 2022, by ethnicity (in millions)
-
Basic Statistic
Uninsured U.S. children total number by family income 2022

Uninsured U.S. children total number by family income 2022
Number of children without health insurance in the U.S. in 2022, by annual family income (in millions)
-
Premium Statistic
People per active physician in the U.S. by specialty 2021
People per active physician in the U.S. by specialty 2021
Number of people per active physician in the U.S. in 2021, by specialty
-
Premium Statistic
U.S. children and adolescents with a primary care visit by age 2017-2019

U.S. children and adolescents with a primary care visit by age 2017-2019
Percentage of children and adolescents in the U.S. with a primary care practitioner visit from 2017 to 2019, by age group*
-
Basic Statistic
Share of U.S. children who visited the dentist in the past year 1997-2019

Share of U.S. children who visited the dentist in the past year 1997-2019
Percentage of children in the United States who visited the dentist in the past year from 1997 to 2019
Miscellaneous
4
- Basic Statistic Birth rate - U.S. girls aged 10-14 years 1991-2022
- Basic Statistic Share of U.S. children who were vaccinated against influenza in 2019, by age
- Premium Statistic Share of children unable to receive mental health care in the U.S. in 2021, by state
- Basic Statistic Child health responsibilities among mothers the U.S. as of 2020
Miscellaneous
-
Basic Statistic
Birth rate - U.S. girls aged 10-14 years 1991-2022

Birth rate - U.S. girls aged 10-14 years 1991-2022
Birth rate for U.S. girls aged 10-14 years from 1991 to 2022 (per 1,000 girls)
-
Basic Statistic
Share of U.S. children who were vaccinated against influenza in 2019, by age

Share of U.S. children who were vaccinated against influenza in 2019, by age
Pecentage of children aged 6 months to 17 years in the United States who had an influenza vaccination in the past 12 months as of 2019, by age
-
Premium Statistic
Share of children unable to receive mental health care in the U.S. in 2021, by state

Share of children unable to receive mental health care in the U.S. in 2021, by state
Share of children who could not receive or found it difficult to get care for their mental health needs in the U.S. in 2021, by state
-
Basic Statistic
Child health responsibilities among mothers the U.S. as of 2020

Child health responsibilities among mothers the U.S. as of 2020
Percentage of U.S. mothers who stated they themselves or their partners had select responsibilities regarding their child's health as of 2020
Further reports
Get the best reports to understand your industry


Contact
Get in touch with us. We are happy to help.


Meredith Alda
Sales Manager– Contact (United States)
Mon - Fri, 9am - 6pm (EST)
Yolanda Mega
Operations Manager– Contact (Asia)
Mon - Fri, 9am - 5pm (SGT)
Kisara Mizuno
Senior Business Development Manager– Contact (Asia)
Mon - Fri, 10:00am - 6:00pm (JST)
Lodovica Biagi
Director of Operations– Contact (Europe)
Mon - Fri, 9:30am - 5pm (GMT)
Carolina Dulin
Group Director - LATAM– Contact (Latin America)
Mon - Fri, 9am - 6pm (EST)