In 2020, the average lifespan of a company on Standard and Poor's 500 Index was just over 21 years, compared with 32 years in 1965. There is a clear long-term trend of declining corporate longevity with regards to companies on the S&P 500 Index, with this expected to fall even further throughout the 2020s.
Average company lifespan on Standard and Poor's 500 Index from 1965 to 2030, in years (rolling-7-year average)
Basic Account
Get to know the platform
You only have access to basic statistics.
This statistic is not included in your account.
Starter Account
The ideal entry-level account for individual users
- Instant access to 1m statistics
- Download in XLS, PDF & PNG format
- Detailed references
$199 USD / Month *
Professional Account
Full access
Business Solutions including all features.
* Prices do not include sales tax.
Other statistics that may interest you Companies worldwide
Overview
8
- Premium Statistic Number of companies worldwide 2000-2021
- Premium Statistic Number of companies worldwide 2000-2021, by region
- Premium Statistic Number of SMEs worldwide 2000-2021
- Premium Statistic Number of SMEs worldwide 2000-2021 by region
- Premium Statistic Distribution of companies worldwide 2020, by industry
- Premium Statistic Number of listed companies worldwide 1975-2019
- Premium Statistic 
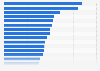
Average company lifespan of S&P 500 companies 1965-2030
- Premium Statistic Oldest companies operating worldwide 2021
Largest companies
8
- Premium Statistic Number of large companies worldwide 2000-2021
- Premium Statistic Number of large companies worldwide 2000-2021, by region
- Basic Statistic Biggest companies in the world by market value 2023
- Premium Statistic Number of Fortune 500 companies worldwide 2000-2023, by country
- Premium Statistic Top companies in the world by revenue 2023
- Premium Statistic Largest companies in the world based on revenues, by number of employees 2023
- Premium Statistic Biggest companies in the world by market capitalization 2009
- Premium Statistic Biggest companies in the world by market capitalization 1989
Startups
7
- Premium Statistic Annual growth in the number of companies worldwide 2001-2021
- Premium Statistic New business registration worldwide 2020, by country
- Premium Statistic Highest valued unicorn companies worldwide 2023
- Premium Statistic Market value of unicorns worldwide as of April 2021, by region
- Premium Statistic Market value of unicorns worldwide as of April 2021, by industry
- Premium Statistic Share of unicorns worldwide H1 2022, by region
- Premium Statistic Share of unicorns worldwide as of November 2022, by industry
Technology & sustainability
8
- Premium Statistic BERD as a share of GDP in OECD countries 2020
- Premium Statistic Scores of global leading sustainable companies 2024
- Premium Statistic Sustainability reporting rate 2020, by sector
- Basic Statistic Growth rate of global sustainability reporting 1993-2020
- Premium Statistic Number of patent applications worldwide 1990-2022
- Premium Statistic Ranking of the 20 countries with the most patent grants 2022
- Premium Statistic Leading companies with the most international patent applications 2022
- Premium Statistic Technologies with the most international patent applications 2022
Diversity
5
- Basic Statistic Global gender pay gap 2015-2023
- Premium Statistic Glass-ceiling index: environment for working women worldwide 2020, by country
- Basic Statistic Workplace gender gap worldwide 2022, by type
- Premium Statistic Number of employees worldwide 1991-2023, by gender
- Premium Statistic Proportion of women in managerial positions worldwide 1991-2021
Covid crisis & recovery
8
- Premium Statistic Forecasted number of business insolvencies 2024, by country
- Premium Statistic Annual growth in global business insolvencies by region 2008-2023
- Premium Statistic Forecasted global real GDP growth 2019-2024
- Premium Statistic Weekly development Dow Jones Industrial Average Index 2020-2024
- Premium Statistic Number of working hours lost worldwide from Q1 2020 to Q2 2022
- Premium Statistic Percentage of working hours lost worldwide 2020, by region
- Premium Statistic Number of Amazon.com employees 2007-2023
- Premium Statistic Pfizer's quarterly revenue 2010-2024
Further related statistics
18
- Returns of S&P 500 IT Index in the U.S. 2007-2022
- Largest holders of cash among non-financial S&P 500 companies in the U.S. 2013
- Returns of S&P 500 Real Estate Index in the U.S. 2007-2022
- U.S. S&P companies with sustainability reporting 2011-2015
- Returns of S&P 500 index in the U.S. 2010-2022, by sector
- Monthly development S&P 500 Index 2018-2024
- S&P 500 EV/EBITDA multiple in the U.S. 2014-2022, by sector
- Returns of S&P 500 Financials Index in the U.S. 2007-2022
- Returns of S&P 500 Industrials Index in the U.S. 2007-2022
- S&P 500 companies who cited coronavirus on earnings calls, by sector Q4 2019
- S&P 500 companies who kept previous 2020 EPS guidance on Q1 earnings calls, by sector
- S&P 500 performance during major crashes as of August 2020
- U.S. dividend yield for S&P 500, 2000-2018
- S&P 500 composite index Earnings Price Ratio 2000-2018
- Mexico: frozen baked goods retail sales 2017-2021
- U.S. Kentucky fastest growing private companies 2023, by three year growth rate
- Quantity of parchment wrap used within 6 months in the U.S. 2020
- Producer price index - U.S. motor vehicle manufacturing 2004-2019
Further Content: You might find this interesting as well
Statistics
- Returns of S&P 500 IT Index in the U.S. 2007-2022
- Largest holders of cash among non-financial S&P 500 companies in the U.S. 2013
- Returns of S&P 500 Real Estate Index in the U.S. 2007-2022
- U.S. S&P companies with sustainability reporting 2011-2015
- Returns of S&P 500 index in the U.S. 2010-2022, by sector
- Monthly development S&P 500 Index 2018-2024
- S&P 500 EV/EBITDA multiple in the U.S. 2014-2022, by sector
- Returns of S&P 500 Financials Index in the U.S. 2007-2022
- Returns of S&P 500 Industrials Index in the U.S. 2007-2022
- S&P 500 companies who cited coronavirus on earnings calls, by sector Q4 2019
- S&P 500 companies who kept previous 2020 EPS guidance on Q1 earnings calls, by sector
- S&P 500 performance during major crashes as of August 2020
- U.S. dividend yield for S&P 500, 2000-2018
- S&P 500 composite index Earnings Price Ratio 2000-2018
- Mexico: frozen baked goods retail sales 2017-2021
- U.S. Kentucky fastest growing private companies 2023, by three year growth rate
- Quantity of parchment wrap used within 6 months in the U.S. 2020
- Producer price index - U.S. motor vehicle manufacturing 2004-2019
Statista. (August 24, 2021). Average company lifespan on Standard and Poor's 500 Index from 1965 to 2030, in years (rolling-7-year average) [Graph]. In Statista. Retrieved June 10, 2024, from https://www.statista.com/statistics/1259275/average-company-lifespan/
Statista. "Average company lifespan on Standard and Poor's 500 Index from 1965 to 2030, in years (rolling-7-year average)." Chart. August 24, 2021. Statista. Accessed June 10, 2024. https://www.statista.com/statistics/1259275/average-company-lifespan/
Statista. (2021). Average company lifespan on Standard and Poor's 500 Index from 1965 to 2030, in years (rolling-7-year average). Statista. Statista Inc.. Accessed: June 10, 2024. https://www.statista.com/statistics/1259275/average-company-lifespan/
Statista. "Average Company Lifespan on Standard and Poor's 500 Index from 1965 to 2030, in Years (Rolling-7-year Average)." Statista, Statista Inc., 24 Aug 2021, https://www.statista.com/statistics/1259275/average-company-lifespan/
Statista, Average company lifespan on Standard and Poor's 500 Index from 1965 to 2030, in years (rolling-7-year average) Statista, https://www.statista.com/statistics/1259275/average-company-lifespan/ (last visited June 10, 2024)
Average company lifespan on Standard and Poor's 500 Index from 1965 to 2030, in years (rolling-7-year average) [Graph], Statista, August 24, 2021. [Online]. Available: https://www.statista.com/statistics/1259275/average-company-lifespan/