OPEC's share of total worldwide natural gas production has remained relatively stable since 2010, standing at 16.1 percent 2022. Since 2012, Iran has been the leading
OPEC's natural gas production as a share of worldwide total from 2010 to 2022
Loading statistic...
Basic Account
Get to know the platform
You only have access to basic statistics.
Starter Account
The ideal entry-level account for individual users
- Instant access to 1m statistics
- Download in XLS, PDF & PNG format
- Detailed references
$199 USD / Month *
Professional Account
Full access
Business Solutions including all features.
* Prices do not include sales tax.
Other statistics that may interest you OPEC
Overview
6
- Premium Statistic Global oil production 1998-2022
- Premium Statistic Global oil refinery capacity 1970-2022
- Premium Statistic Global oil consumption 1970-2022
- Premium Statistic Global crude oil export value by country 2022
- Basic Statistic Voluntary oil output cuts by OPEC+ countries 2023
- Basic Statistic OPEC oil demand 2019-2045
Reserves
4
Production and refinery
6
- Premium Statistic OPEC's crude oil production 1998-2022
- Premium Statistic OPEC 's global crude oil production share 2010-2022
- Basic Statistic OPEC natural gas production by country 2012-2022
- Basic Statistic 
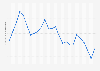
OPEC's global natural gas production share 2010-2022
- Basic Statistic OPEC refinery capacity 2010-2022
- Premium Statistic OPEC refinery capacity 2012-2022, by member state
Prices
4
Trade
5
- Basic Statistic OPEC's net oil export revenue 2021-2024
- Basic Statistic OPEC net oil export revenue streams by country 2022
- Premium Statistic Global crude oil exports by OPEC countries 2012-2022
- Premium Statistic Oil exports from OPEC regions 2021
- Basic Statistic OPEC oil exports 2012-2022, by region
Selected member state profiles
8
- Premium Statistic Algeria's fossil fuels industry select information 2022
- Premium Statistic Angola's fossil fuels industry selected figures 2022
- Premium Statistic Equatorial Guinea's fossil fuels industry selected figures 2022
- Premium Statistic Gabon's fossil fuels industry selected figures 2022
- Premium Statistic Iran's fossil fuels industry select information 2021
- Premium Statistic Iraq's fossil fuels industry select information 2021
- Basic Statistic Kuwait's fossil fuels industry selected figures 2021
- Basic Statistic Libya's fossil fuels industry select information 2022
Further related statistics
15
- Italy: number of offshore natural gas producing wells 2012-2022
- Natural gas production in Europe and CIS 1998-2020
- Monthly natural gas production in Mexico 2019-2023
- ConocoPhillips' U.S. natural gas production 2016-2022
- Natural gas production in the European Union 1998-2022
- ExxonMobil's U.S. natural gas production 2010-2023
- Production increase of natural gas worldwide by region, 2019 compared to 2018
- Natural gas production in Denmark 2005-2022
- PetroChina's natural gas production 2010-2023
- Natural gas production in Norway 2005-2022
- Global shale gas production by select country 2015-2040
- Gas wells completed in Canada 1955-2019
- Nigeria's planned natural gas projects 2016
- Global export share of leading natural gas exporters 2019
- Global natural gas discoveries 2011-2018
Further Content: You might find this interesting as well
Statistics
- Italy: number of offshore natural gas producing wells 2012-2022
- Natural gas production in Europe and CIS 1998-2020
- Monthly natural gas production in Mexico 2019-2023
- ConocoPhillips' U.S. natural gas production 2016-2022
- Natural gas production in the European Union 1998-2022
- ExxonMobil's U.S. natural gas production 2010-2023
- Production increase of natural gas worldwide by region, 2019 compared to 2018
- Natural gas production in Denmark 2005-2022
- PetroChina's natural gas production 2010-2023
- Natural gas production in Norway 2005-2022
- Global shale gas production by select country 2015-2040
- Gas wells completed in Canada 1955-2019
- Nigeria's planned natural gas projects 2016
- Global export share of leading natural gas exporters 2019
- Global natural gas discoveries 2011-2018
Topics
OPECOPEC. (December 14, 2023). OPEC's natural gas production as a share of worldwide total from 2010 to 2022 [Graph]. In Statista. Retrieved June 10, 2024, from https://www.statista.com/statistics/292591/global-natural-gas-production-opec-share/
OPEC. "OPEC's natural gas production as a share of worldwide total from 2010 to 2022." Chart. December 14, 2023. Statista. Accessed June 10, 2024. https://www.statista.com/statistics/292591/global-natural-gas-production-opec-share/
OPEC. (2023). OPEC's natural gas production as a share of worldwide total from 2010 to 2022. Statista. Statista Inc.. Accessed: June 10, 2024. https://www.statista.com/statistics/292591/global-natural-gas-production-opec-share/
OPEC. "Opec's Natural Gas Production as a Share of Worldwide Total from 2010 to 2022." Statista, Statista Inc., 14 Dec 2023, https://www.statista.com/statistics/292591/global-natural-gas-production-opec-share/
OPEC, OPEC's natural gas production as a share of worldwide total from 2010 to 2022 Statista, https://www.statista.com/statistics/292591/global-natural-gas-production-opec-share/ (last visited June 10, 2024)
OPEC's natural gas production as a share of worldwide total from 2010 to 2022 [Graph], OPEC, December 14, 2023. [Online]. Available: https://www.statista.com/statistics/292591/global-natural-gas-production-opec-share/